
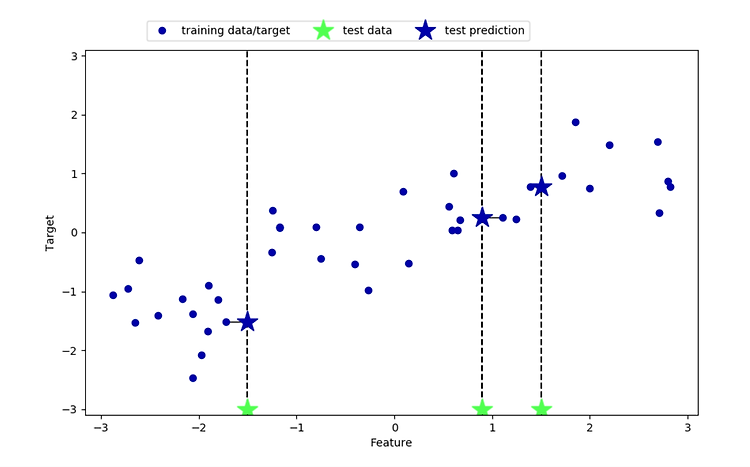
코드를 통해서 알아본다 . import scipy as sp import numpy as np import matplotlib.pyplot as plt import pandas as pd import mglearn mglearn.plots.plot_knn_regression(n_neighbors=1) mglearn.plots.plot_knn_regression(n_neighbors=3) plt.show() 결과값
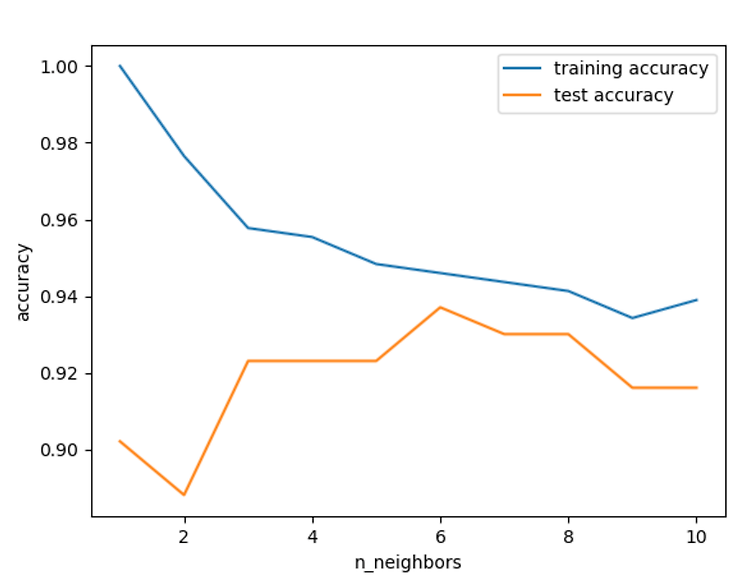
코드를 통해서 알아본다 . from sklearn.datasets import load_breast_cancer from sklearn.model_selection import train_test_split from sklearn.neighbors import KNeighborsClassifier import sklearn.datasets import scipy as sp import numpy as np import matplotlib.pyplot as plt import pandas as pd import mglearn cancer = load_breast_cancer() X_train, X_test, y_train, y_test = train_test_split(cancer.data, cancer...
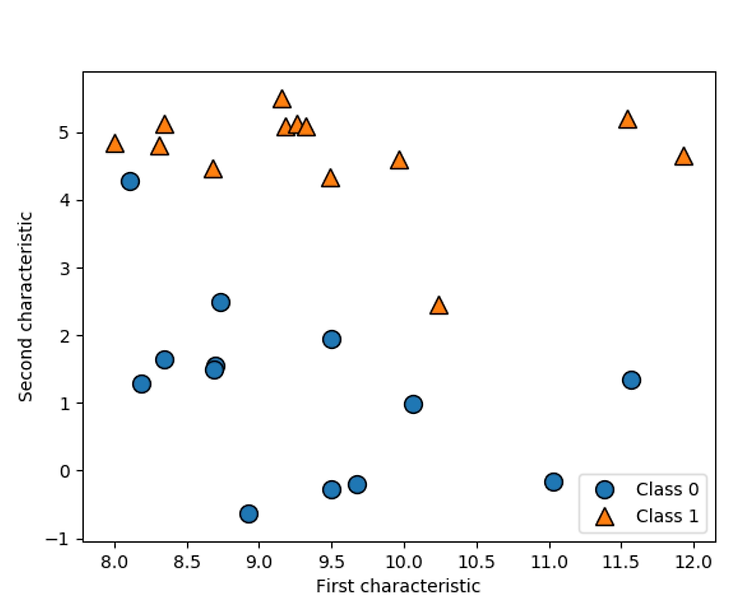
forge() 사용해보기 . import numpy as np import scipy as sp import matplotlib.pyplot as plt import pandas as pd import mglearn # 데이터셋 만들기 # 인위적으로 만든 이진 분류 데이터셋 X, y = mglearn.datasets.make_forge() # 산점도 그리기 mglearn.discrete_scatter(X[:, 0], X[:, 1], y) plt.legend(["Class 0", "Class 1"], loc=4) plt.xlabel("First characteristic") # 첫 번째 특성 plt.ylabel("Second characteristic") # 두 번째 특성 print("X.shape: {}..
분류 ( classification ) 와 회귀 ( regression ) 1. 분류는 가능성 있는 클래스 레이블 중 하나를 예측 è 이진 분류 ( binary classification ) : 두 개의 클래스 분류 è 다중 분류 ( multiclass classification ) : 셋 이상의 클래스 분류 ( 붓꽃 품종 ) è 언어의 종류를 분류 ( 한국어와 프랑스어 사이에 다른 언어가 없다 ) 2. 회귀는 연속적인 숫자(실수)를 예측 è 교육, 나이, 주거지를 바탕으로 연간 소득 예측è 전년도 수확량, 날씨, 고용자수로 올해 수확량 예측è 예측 값에 미묘한 차이가 크게 중요하지 않음 3. 일반화, 과대적합, 과소적합 è 일반화 ( generalization ) : 훈련 세트로 학습한 모델을 테스트 ..
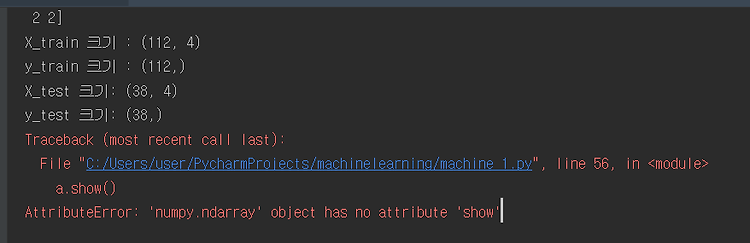
Iris Dataset은 머신러닝을 연습하기 위한 좋은 예제이다 . 코드를 통해서 알아보자 . from sklearn.datasets import load_iris from sklearn.model_selection import train_test_split import pandas as pd import mglearn import matplotlib.pyplot as plt위 코드는 머신러닝을 통하여서 , 시각화할 것인데 , 이 때 필요한 패키지들이다 . sklearn이 메인 library이다 . pandas는 데이터들을 데이터프레임으로 만들 때 사용할 것이고 , mglearn 과 matplotlib 은 가공한 데이터를 시각화 할 때 사용한다 . 본격적으로 확인해 보자 . 다음은 iris dataset..
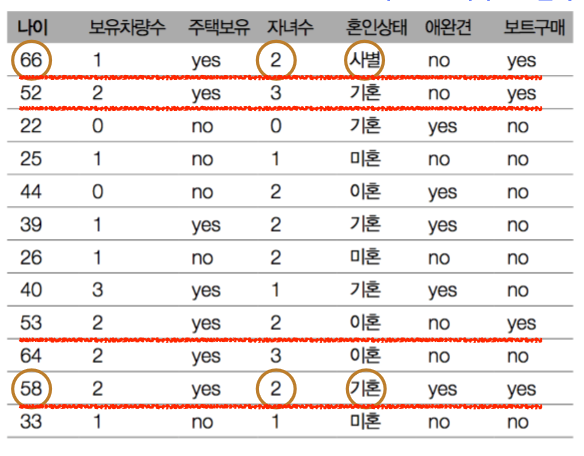
머신러닝이란 ? 1. 데이터에서 지식을 추출하는 작업2. 통계학, 인공지능, 컴퓨터 과학이 어우러진 연구분야3. 예측 분석이나 통계적 머신러닝으로도 불림 딥러닝 , 머신러닝 , AI 포함관계 딥러닝 < 머신러닝 < AI 머신러닝에는 지도학습과 비지도학습이 존재한다 . 지도 학습 ( Supervised Learning ) 1. 알고리즘에 입력과 기대하는 출력을 제공 2. 알고리즘은 입력으로 부터 기대하는 출력을 만드는 방법을 찾음 비지도 학습 ( Unsupervised Learning ) 1. 알고리즘에 입력은 주어지지만 출력은 제공되지 않음 2. 따라서 비지도 학습의 성공을 평가하기 어려움 데이터와 특성 다음과 같은 데이터가 있을 때, [나이,성별,구매빈도,이메일]은 특성(features) = 속성이라고..