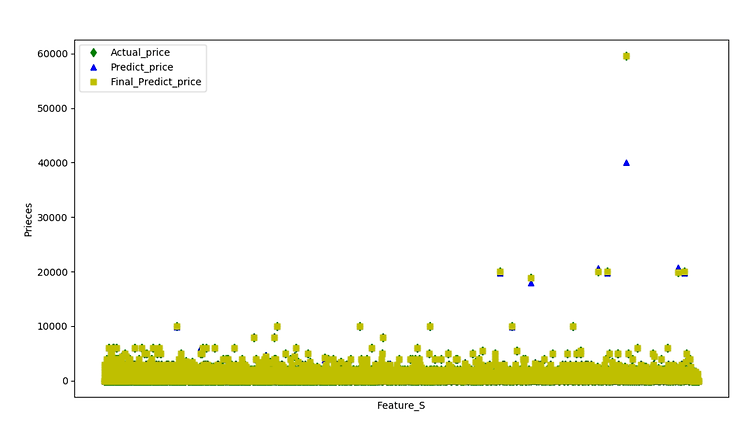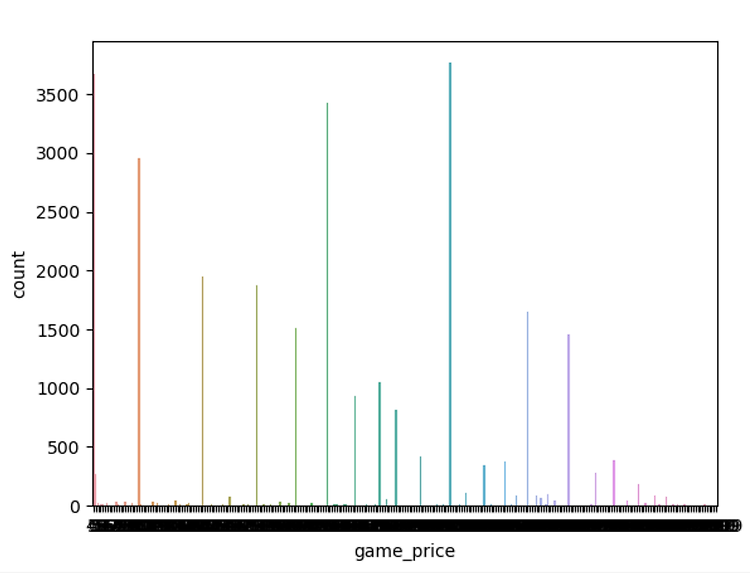

코드를 보면서 확인해 보겠다.
import pandas as pd
import numpy as np
import statsmodels.api as sm
from sklearn import linear_model
from sklearn.linear_model import LinearRegression
import matplotlib.pyplot as plt
먼저 필요한 library를 임포트한다.
# Excel read
pd.set_option('display.max_columns', None)
DATA_PATH ="C:/Users/user/Desktop/Data/Data.xlsx"
full_dataframe = pd.read_excel(DATA_PATH, sep=',')
X = full_dataframe[["game_positive","game_negative","game_owners","game_initialprice","game_discount"]]
y = full_dataframe["game_price"]
엑셀을 읽어온 뒤 X,y로 내가 예측하고자 하는 값은 y에 y에 필요한 feature은 x에 각각 나누어주었다.
# Note the difference in argument order
model = sm.OLS(y,X).fit()
sm.OLS를 사용하여서 feature가 game_price에 미치는 영향을 알아본다.
# make the predictions by the model
predictions = model.predict(X)
모델의 예측을 알아보기 위해 위코드를 사용.
#Print out the statistics
model.summary()
결과값은 다음과같다.
============================================================================
Dep. Variable: game_price R-squared: 0.969
Model: OLS Adj. R-squared: 0.969
Method: Least Squares F-statistic: 1.860e+05
Date: Sun, 19 May 2019 Prob (F-statistic): 0.00
Time: 20:36:31 Log-Likelihood: -2.0139e+05
No. Observations: 29304 AIC: 4.028e+05
Df Residuals: 29299 BIC: 4.028e+05
Df Model: 5
Covariance Type: nonrobust
============================================================================
coef std err t P>|t| [0.025 0.975]
-------------------------------------------------------------------------------------
game_positive -5.232e-05 0.000 -0.442 0.659 -0.000 0.000
game_negative -0.0001 0.001 -0.280 0.780 -0.001 0.001
game_owners 3.187e-06 1.5e-06 2.123 0.034 2.45e-07 6.13e-06
game_initialprice 0.9506 0.001 957.522 0.000 0.949 0.953
game_discount -11.1477 0.091 -123.073 0.000 -11.325 -10.970
============================================================================
Omnibus: 88666.720 Durbin-Watson: 1.954
Prob(Omnibus): 0.000 Jarque-Bera (JB): 22415381288.077
Skew: -44.353 Prob(JB): 0.00
Kurtosis: 4286.730 Cond. No. 7.44e+04
============================================================================
여기서 볼 내용은 coef와 R-squared이다.
coef는 각 feature가 1씩 증가함에 따라 price에 미치는 영향이다.
R-squared는 제곱근을 의미하는데 이 값이 1에 가까울 수록 데이터에 fit하다고 생각하면 된다.
이정도만 확인하고 넘어간다.
다시 코드로 넘어간다.
im = linear_model.LinearRegression()
model = im.fit(X,y)
prediction_linear = im.predict(X)
이제 linear 모델을 만들것이고 예측을 할 준비를 한다.
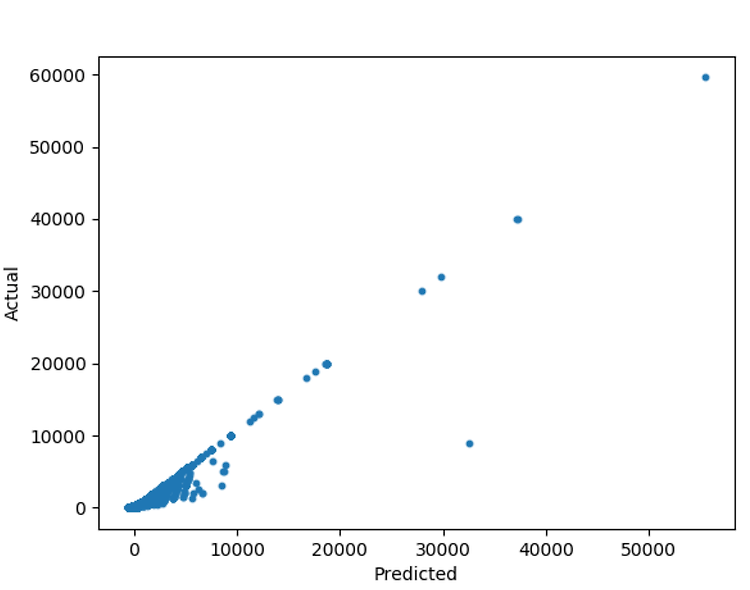
예측값과 실제값을 비교해본다.
# 예측값과 실제값을 비교
plt.scatter(prediction_linear,y,s=10)
plt.xlabel("Predicted")
plt.ylabel("Actual")
plt.show()
결과값

조금더 알아보고자 다음 코드를 사용해 보았다.
print("coef :"+str(im.coef_))
print("score :"+str(im.score(X,y)))
print("intercept :"+str(im.intercept_))
결과값
coef :[-6.58419961e-05 1.59727445e-04 1.29593935e-07 9.30383123e-01
-1.16008179e+01]
score :0.9566722956471095
intercept :53.1834889494703
그렇다면 위와같은 정보를 기반으로 내가 예측한 값과 기존의 값은 어떻게 변했을까...
다음 코드를 보자.
# 실질적으로 예측된 가격을 예측전의 가격과 비교해 보고싶어서 합쳐준다.
# 일단 딕셔너리 형태로 저장
Result = {
'Actual price' : y,
'predict price' : prediction_linear
}
# 저장되어진 딕셔너리형태를 Dataframe형태로 저장
Result_df = pd.DataFrame(Result)
print(Result_df)
결과값
Actual price predict price
0 0 38.463042
1 2999 2895.686163
2 0 -53.560163
3 0 27.872660
4 0 42.185356
5 0 44.730816
6 999 969.332691
길어서 head(7)까지만 가져와보았다.
이처럼 linear regression을 사용해서 game_price을 예측해 보았다.
'학부공부 > 빅데이터기술_프로젝트' 카테고리의 다른 글
| 추가부분 (gradientboostring을 사용해서 예측전후의 편차줄이기) (0) | 2019.05.25 |
|---|---|
| 빅데이터기술_최종발표(game_price예측) (0) | 2019.05.25 |
| 프로젝트_중간점검(데이터정제과정) (0) | 2019.05.19 |
| 데이터 모으기(4) (0) | 2019.05.05 |
| HTTP Error 403: Forbidden (0) | 2019.05.05 |

#IT #먹방 #전자기기 #일상
#개발 #일상


