
Steam_game_Analysis_3
저번에 이어서 , 추천수와 , Genre , Metacritic의 값에 따른 분석을 해 볼 것이다.
코드를 보면서 확인해 보자.
저번에 사용했던 CSV 파일을 기반으로 한다.
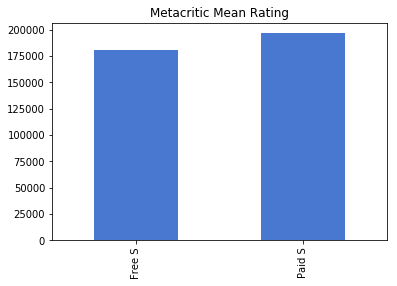
Free_Game Vs Pair Game 의 Metacritic 점수를 비교해 본다 .
d = {'one' : pd.Series([fs[0], nfs[0]], index=['Free S', 'Paid S'])}
# Scoring
df = pd.DataFrame(d)
df.plot(kind='bar', title="Metacritic Mean Rating", legend=False)
plt.savefig("C:/Users/user/Desktop/졸작/Steam게임데이타(Github)/FreeVsPair_metacritic_bar.png", bbox_inches='tight');
결과화면은 다음과 같다.
보게 되면 , 상대적으로 Pair_Game이 Free_Game 보다 Metacritic의 점수가 높은 것을 알 수 있다.
물론 이것또한 상대적인 값이다.
그렇다면 , Metacritic 과 RecommendationCount는 어떤 관계를 가질까??
코드를 보면서 확인해 본다.
c = plt.scatter(DF['Metacritic'],DF['RecommendationCount'], color=sea.color_palette()[0])
plt.xlabel('Metacritic Score')
plt.ylabel('Recommendation Count')
plt.xlim((20,100))
plt.ylim(0, 100000)
plt.savefig("C:/Users/user/Desktop/졸작/Steam게임데이타(Github)/Metacritic_Recommendation_scatter.png", bbox_inches='tight');
결과화면은 다음과 같다.
얼핏 보면 양의 관계를 가지는 것처럼 보이지만 , 데이터 양을 고려했을 때 , 양의관계는 아닌것 같다.
Metacritic의 점수와 Recommendation Count 를 비교해 보았을 때 ,
Metacritic의 점수에 따라서 , 어느정도의 추천수가 있다는 것까지 알 수 있을 것 같다.
그래도 , Metacritic의 점수가 증가함에 따라서 , Recommendation Count의 분포가 높아지는 것까지 알 수 있었다.
그렇다면 , 어떤 장르가 제일 높은 평가를 받았을까??
코드를 보면서 확인해 본다.
gng = DF[DF['GenreIsNonGame'] == True].count()
gngr = DF[(DF['GenreIsNonGame'] == True) & DF['RecommendationCount']].mean()
gngs = DF[(DF['GenreIsNonGame'] == True) & DF['Metacritic']].mean()
print ("There are", gng[1], "NonGame games, with an average of", gngr[1], "ratings per game.")
print ("There are", gng[1], "NonGame games, with an average rating of", gngs[0], "per game.")
gi = DF[DF['GenreIsIndie'] == True].count()
gir = DF[(DF['GenreIsIndie'] == True) & DF['RecommendationCount']].mean()
gis = DF[(DF['GenreIsIndie'] == True) & DF['Metacritic']].mean()
print ("There are", gi[1], "Indie games, with an average of", gir[1], "ratings per game.")
print ("There are", gi[1], "Indie games, with an average rating of", gis[0], "per game.")
gac = DF[DF['GenreIsAction'] == True].count()
gacr = DF[(DF['GenreIsAction'] == True) & DF['RecommendationCount']].mean()
gacs = DF[(DF['GenreIsAction'] == True) & DF['Metacritic']].mean()
print ("There are", gac[1], "Action games, with an average of", gacr[1], "ratings per game.")
print ("There are", gac[1], "Action games, with an average rating of", gacs[0], "per game.")
gad = DF[DF['GenreIsAdventure'] == True].count()
gadr = DF[(DF['GenreIsAdventure'] == True) & DF['RecommendationCount']].mean()
gads = DF[(DF['GenreIsAdventure'] == True) & DF['Metacritic']].mean()
print ("There are", gad[1], "Adventure games, with an average of", gadr[1], "ratings per game.")
print ("There are", gad[1], "Adventure games, with an average rating of", gads[0], "per game.")
gc = DF[DF['GenreIsCasual'] == True].count()
gcr = DF[(DF['GenreIsCasual'] == True) & DF['RecommendationCount']].mean()
gcs = DF[(DF['GenreIsCasual'] == True) & DF['Metacritic']].mean()
print ("There are", gc[1], "Casual games, with an average of", gcr[1], "ratings per game.")
print ("There are", gc[1], "Casual games, with an average rating of", gcs[0], "per game.")
gst = DF[DF['GenreIsStrategy'] == True].count()
gstr = DF[(DF['GenreIsStrategy'] == True) & DF['RecommendationCount']].mean()
gsts = DF[(DF['GenreIsStrategy'] == True) & DF['Metacritic']].mean()
print ("There are", gst[1], "Strategy games, with an average of", gstr[1], "ratings per game.")
print ("There are", gst[1], "Strategy games, with an average rating of", gsts[0], "per game.")
grpg = DF[DF['GenreIsRPG'] == True].count()
grpgr = DF[(DF['GenreIsRPG'] == True) & DF['RecommendationCount']].mean()
grpgs = DF[(DF['GenreIsRPG'] == True) & DF['Metacritic']].mean()
print ("There are", grpg[1], "RPG games, with an average of", grpgr[1], "ratings per game.")
print ("There are", grpg[1], "RPG games, with an average rating of", grpgs[0], "per game.")
gsi = DF[DF['GenreIsSimulation'] == True].count()
gsir = DF[(DF['GenreIsSimulation'] == True) & DF['RecommendationCount']].mean()
gsis = DF[(DF['GenreIsSimulation'] == True) & DF['Metacritic']].mean()
print ("There are", gsi[1], "Simulation games, with an average of", gsir[1], "ratings per game.")
print ("There are", gsi[1], "Simulation games, with an average rating of", gsis[0], "per game.")
gea = DF[DF['GenreIsEarlyAccess'] == True].count()
gear = DF[(DF['GenreIsEarlyAccess'] == True) & DF['RecommendationCount']].mean()
geas = DF[(DF['GenreIsEarlyAccess'] == True) & DF['Metacritic']].mean()
print ("There are", gea[1], "EarlyAccess games, with an average of", gear[1], "ratings per game.")
print ("There are", gea[1], "EarlyAccess games, with an average rating of", geas[0], "per game.")
gftp = DF[DF['GenreIsFreeToPlay'] == True].count()
gftpr = DF[(DF['GenreIsFreeToPlay'] == True) & DF['RecommendationCount']].mean()
gftps = DF[(DF['GenreIsFreeToPlay'] == True) & DF['Metacritic']].mean()
print ("There are", gftp[1], "FreeToPlay games, with an average of", gftpr[1], "ratings per game.")
print ("There are", gftp[1], "FreeToPlay games, with an average rating of", gftps[0], "per game.")
gsp = DF[DF['GenreIsSports'] == True].count()
gspr = DF[(DF['GenreIsSports'] == True) & DF['RecommendationCount']].mean()
gsps = DF[(DF['GenreIsSports'] == True) & DF['Metacritic']].mean()
print ("There are", gsp[1], "Sports games, with an average of", gspr[1], "ratings per game.")
print ("There are", gsp[1], "Sports games, with an average rating of", gsps[0], "per game.")
gr = DF[DF['GenreIsRacing'] == True].count()
grr = DF[(DF['GenreIsRacing'] == True) & DF['RecommendationCount']].mean()
grs = DF[(DF['GenreIsRacing'] == True) & DF['Metacritic']].mean()
print ("There are", gr[1], "Racing games, with an average of", grr[1], "ratings per game.")
print ("There are", gr[1], "Racing games, with an average rating of", grs[0], "per game.")
gmmo = DF[DF['GenreIsMassivelyMultiplayer'] == True].count()
gmmor = DF[(DF['GenreIsMassivelyMultiplayer'] == True) & DF['RecommendationCount']].mean()
gmmos = DF[(DF['GenreIsMassivelyMultiplayer'] == True) & DF['Metacritic']].mean()
print ("There are", gmmo[1], "MassivelyMultiplayer games, with an average of", gmmor[1], "ratings per game.")
print ("There are", gmmo[1], "MassivelyMultiplayer games, with an average rating of", gmmos[0], "per game.")
d = {'one' : pd.Series([gngr[1], gir[1], gacr[1], gadr[1], gcr[1], gstr[1], grpgr[1],
gsir[1], gear[1], gftpr[1], gspr[1], grr[1], gmmor[1]],
index=['NonGame', 'Indie', 'Action', 'Adventure', 'Casual', 'Strategy', 'RPG',
'Simulation', 'Early Access', 'Free To Play', 'Sports', 'Racing', 'MMO'])}#Rating
df = pd.DataFrame(d)
df.plot(kind='bar', title='Ratings Count by Genre', legend=False)
plt.savefig("C:/Users/user/Desktop/졸작/Steam게임데이타(Github)/genre_ratings_bar.png", bbox_inches='tight');
위 코드는 , Metacritic의 값과 Recommendation Count 의 값을 합쳐서 나타내 본 것이다.
결과 값은 다음과 같다.
장르에 따른 결과를 보았을 때 , 상대적으로 Early Access 장르가 제일 높은 평가를 받았고 ,
Action , Strategy , Racing 장르가 상대적으로 비슷한 결과가 나왔고 , 제일 낮은 평가를 받았다.
그렇다면 , 게임의 가격과 추천수도 관계가 있을까??
다음 코드를 보면서 확인해 본다.
c = plt.scatter(DF['PriceInitial'],DF['RecommendationCount'], color=sea.color_palette()[0])
plt.xlabel("Initial Price")
plt.ylabel("Number of Recommendations")
plt.xlim((0,80))
plt.ylim((0, 100000))
plt.savefig("C:/Users/user/Desktop/졸작/Steam게임데이타(Github)/price_recommendations_scatter.png", bbox_inches='tight');
결과 화면은 다음과 같다.
위 그림은 , 초기가격과 추천수를 비교해 본 것이다.
가격에 따라서 추천수는 당연히 존재하는데 , 상대적으로 낮은 가격에 추천수가 뭉쳐있는 분포를 나타내는 것을 알 수 있다.
그렇다면 , Metacritic 의 값은 초기가격과 어떠한 관계를 가질까??
코드를 보면서 확인해 본다.
c = plt.scatter(DF['PriceInitial'], DF['Metacritic'], color=sea.color_palette()[0])
plt.xlabel("Initial Price in USD")
plt.ylabel("Mean Metacritic Score")
plt.xlim((0,80))
plt.ylim((20,100))
plt.savefig("C:/Users/user/Desktop/졸작/Steam게임데이타(Github)/Price_Metacritic_Scatter.png", bbox_inches='tight');
결과 화면은 다음과 같다.
위 그림도 , 가격에 따라서 어느정도의 Metacritic의 값이 존재한다.
Recommendation Count와 다른 것은 , 상대적으로 낮은 초기 가격에 따라서 , 50~90 사이의 Metacritic score의 점수가 뭉쳐있는 걸 확인할 수 있다.
위의 plot들은 x,y축의 점수제한을 두고 보았다.
좀 더 자세하게 알아 볼 수 있게 ,
x,y축의 점수 제한을 없애본다.
다음 코드를 보면서 확인해 본다.
c = plt.scatter(DF['Metacritic'],DF['RecommendationCount'], color=sea.color_palette()[0])
plt.xlabel('Metacritic Score')
plt.ylabel('Recommendation Count')
plt.savefig("C:/Users/user/Desktop/졸작/Steam게임데이타(Github)/Metacritic_Recommendation_Scatter_All.png", bbox_inches='tight');
다음은 결과 화면이다.
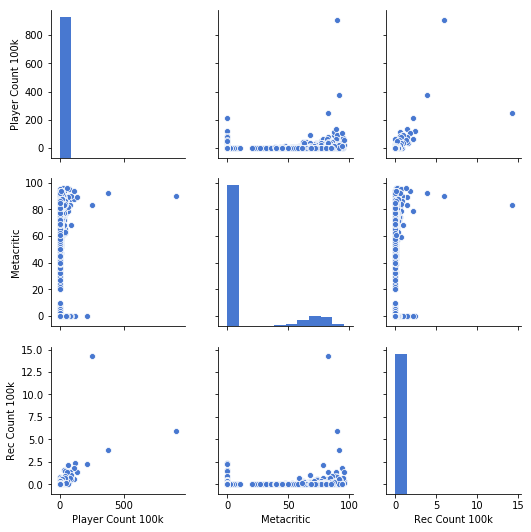
위 그림보다는 명확하게 분포의 형태가 보인다.
Metacritic 과 Recommendation Count 를 비교해 본다.
결과값을 보기 전 , 나는 Metacritic의 점수가 높아 질 수록 Recommendation Count의 값도 증가할 줄 알았다.
Metacritic은 전문가의 의견이고 , 좀 더 세밀하게 분석한 값이라고 생각을 하였기 때문이다 .
그렇지만 , 결과값은 그렇지 않다.
이것을 통해 알 수 있는 것은 , "Metacritic의 값이 높아 진다고 해서 , 사용자들의 추천수가 증가하는 것은 아니다"
라는 것을 알 수 있었다.
그렇다면 , 초기 가격과 추천수는 어떠한 형태를 나타낼까??
코드를 보면서 확인해 본다.
c = plt.scatter(DF['PriceInitial'],DF['RecommendationCount'], color =sea.color_palette()[0])
plt.xlabel("Initial Price in USD")
plt.ylabel("Number of Recommendations")
plt.savefig("C:/Users/user/Desktop/졸작/Steam게임데이타(Github)/Price_Recommendations_Scatter_All.png", bbox_inches='tight');
다음은 결과화면이다.
위 그림을 통해서 , 초기가격이 낮았을 때 , 상대적으로 추천 분포가 뭉쳐있다는 것을 알 수 있다.
다시 생각해 보면 , 가격이 낮을 수록 , 추천수가 존재한다는 정도를 알 수 있었다.
그렇다면 , Metacritic과 초기 가격은 어떠한 형태를 나타낼까 ??
코드를 보면서 확인해 본다 .
c = plt.scatter(DF['PriceInitial'], DF['Metacritic'], color=sea.color_palette()[0])
plt.xlabel("Initial Price in USD")
plt.ylabel("Mean Metacritic Score")
plt.savefig("C:/Users/user/Desktop/졸작/Steam게임데이타(Github)/Price_Metacritic_Scatter_All.png", bbox_inches='tight');
결과화면은 다음과 같다.
초기 가격이 낮았을 때 , Metacritic의 점수가 높은 곳에 많은 분포를 나타냈다.
Metacritic의 점수가 높은 것들은 대체로 낮은 가격대에서 찾을 수 있었다.
위 결과들을 정리해 보면 다음과 같다 .
1. 상대적으로 Pair_Game이 Free_Game 보다 Metacritic의 점수가 높은 것을 알 수 있다.
2. Metacritic의 점수와 Recommendation Count 를 비교해 보았을 때 ,
Metacritic의 점수에 따라서 , 어느정도의 추천수가 있다는 것까지 알 수 있을 것 같다.
그래도 , Metacritic의 점수가 증가함에 따라서 , Recommendation Count의 분포가 높아지는 것까지 알 수 있었다.
3. 장르에 따른 결과를 보았을 때 , 상대적으로 Early Access 장르가 제일 높은 평가를 받았고 ,
Action , Strategy , Racing 장르가 상대적으로 비슷한 결과가 나왔고 , 제일 낮은 평가를 받았다.
4. 초기가격과 추천수를 비교해 본 것이다.
가격에 따라서 추천수는 당연히 존재하는데 , 상대적으로 낮은 가격에 추천수가 뭉쳐있는 분포를 나타내는 것을 알 수 있다.
5. 가격에 따라서 어느정도의 Metacritic의 값이 존재한다.
Recommendation Count와 다른 것은 , 상대적으로 낮은 초기 가격에 따라서 , 50~90 사이의 Metacritic score의 점수가 뭉쳐있는 걸 확인할 수 있다.
6. "Metacritic의 값이 높아 진다고 해서 , 사용자들의 추천수가 증가하는 것은 아니다"
라는 것을 알 수 있었다.
7.초기가격이 낮았을 때 , 상대적으로 추천 분포가 뭉쳐있다는 것을 알 수 있다.
다시 생각해 보면 , 가격이 낮을 수록 , 추천수가 존재한다는 정도를 알 수 있었다.
8.초기 가격이 낮았을 때 , Metacritic의 점수가 높은 곳에 많은 분포를 나타냈다.
Metacritic의 점수가 높은 것들은 대체로 낮은 가격대에서 찾을 수 있었다.
'졸업작품_preparing.... > R_작업' 카테고리의 다른 글
| Steam_game_Analysis_2(FreeVsPair_Game 비교) (0) | 2019.01.20 |
|---|---|
| Steam_game_Analysis_1 (0) | 2019.01.20 |
| Steam 에서 특정 태그에 해당하는 태그 성향 분석하기 1 (2) | 2018.12.25 |

#IT #먹방 #전자기기 #일상
#개발 #일상


