
우선 글을 쓰기 전에 , 참고한 사이트는 다음과 같다 .
https://github.com/Kiminwoo/steam-data
위 사이트를 들어가면 , Steam 게임들을 정리해 놓은 csv파일과 , 분석해 놓은 글이 있다.
csv파일은 2017년까지의 데이터만 있다.
언어는 Python을 사용한다.
나도 여기서 도움을 받고 , 어떤식으로 분석을 했는지 확인해 보았다.
코드를 보면서 확인해 본다 .
필요한 library 로딩
import scipy as sp
import matplotlib.pyplot as plt
import seaborn as sea
import pandas as pd
데이터 시각화 지정
sea.set_palette("muted")
Exel 파일로 저장되어진 게임 데이타를 불러온다.
data = pd.read_excel('C:/Users/user/Desktop/졸작/Steam게임데이타(Github)/Steam_game_data.xlsx',sheet_name='Steam_game_data')
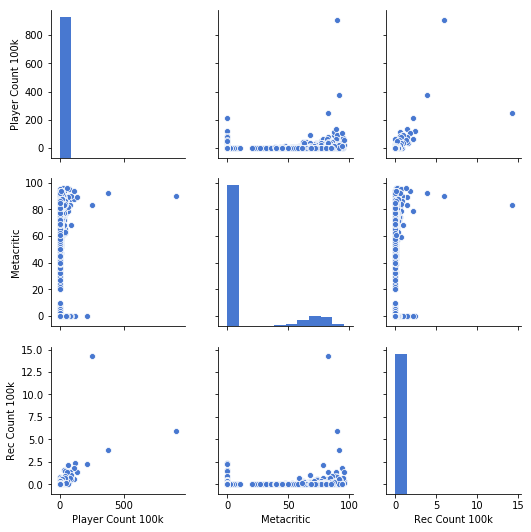
추천수와 게임사용자수와 어떤 관계가 있는지 알아보고자 , 다음처럼 pairplot으로 뽑아 보았다.
data["Rec Count 100k"] = data["RecommendationCount"] / 100000.0
data["Player Count 100k"] = data["SteamSpyPlayersEstimate"] / 100000.0
INTERESTING_NUMERICS = [
"Player Count 100k",
"Metacritic",
"Rec Count 100k"
]
plt.figure(figsize=(12,12));
sea.pairplot(data[INTERESTING_NUMERICS]);
plt.savefig("C:/Users/user/Desktop/졸작/Steam게임데이타(Github)/numeric-data4.png",bbox_inches='tight');
다음은 , 추천수와 사용자수에 따른 distplot으로 표현해 본것이다.
distplot은 histogram과 비슷하다.
class PER:
def __init__(self, per):
self.per = per
def see_one(name, nonzero=True, bound=None, ax=None):
print(name)
d = data
if nonzero:
d = d[d[name] > 0.0]
if bound:
if isinstance(bound, PER):
max_index = int(len(d[name]) * bound.per)
bound = d[name].copy().sort_values().head(max_index).values[-1]
print("Using upper bound", bound)
d = d[d[name] < bound]
d = d[name]
print(d.describe())
print('-'*20)
if ax is None:
plt.figure()
sea.distplot(d, kde=True, rug=False, ax=ax)
fig, axes = plt.subplots(1, 2, figsize=(12,4));
for ax, col in zip(axes.flatten(), ["SteamSpyPlayersEstimate", "RecommendationCount"]):
see_one(col, nonzero=True, bound=PER(0.90), ax=ax)
plt.savefig("C:/Users/user/Desktop/졸작/Steam게임데이타(Github)/player_count_recommends_distribution2.png", bbox_inches='tight');
distplot형태는 다음과 같다.
다음은 joinplot을 사용하여서 , 보다 쉽게 사용자의수와 추천수를 확인해 본 것이다
rec_num = data[["RecommendationCount", "SteamSpyPlayersEstimate"]].copy()
def get_bound(name):
max_index = int(len(rec_num[name]) * 0.75)
bound = rec_num[name].copy().sort_values().head(max_index).values[-1]
return bound
def one_filt(src,name):
return src[ (src[name] > 0) & (src[name] < get_bound(name)) ]
to_check = one_filt(one_filt(rec_num, "RecommendationCount"), "SteamSpyPlayersEstimate")
sea.jointplot("SteamSpyPlayersEstimate", "RecommendationCount", data=to_check, kind="reg");
plt.savefig("C:/Users/user/Desktop/졸작/Steam게임데이타(Github)/player-count-recommends-jointwithreg.png", bbox_inches='tight');
다음은 joinplot의 결과화면이다.
이를 통해서 사용자수와 추천수는 양의 관계를 가진다는 것을 정확하게 알 수 있다.
'졸업작품_preparing.... > R_작업' 카테고리의 다른 글
| Steam_game_Analysis_3(Genre , Recommendation Count , Metacritic ) (1) | 2019.01.24 |
|---|---|
| Steam_game_Analysis_2(FreeVsPair_Game 비교) (0) | 2019.01.20 |
| Steam 에서 특정 태그에 해당하는 태그 성향 분석하기 1 (2) | 2018.12.25 |

#IT #먹방 #전자기기 #일상
#개발 #일상


